...
If you have been working through the Qube 101 documentation in order, you will probably be running the Wrangler View, which has a white background and an "Administration" menu item across the top. In this section we are going to skim across the surface of the qubeArtistView UI, but most of the things covered here will also be true in the Wrangler View, though you may have to look in slightly different spots to locate them.
| Note | ||
|---|---|---|
| ||
The Qube Client package must be installed on your machine in order for you to find and run the Qube Artist View. If you cannot find the Artist View UI on your machine, review the instructions for Installing Qube. |
...
- Windows: Click on the black and white Qube ArtistView desktop icon, or locate it in the Program Files\pfx\qube\bin qubeArtistView folder (Note: not the "Program Files (x86)" folder)
- OS X: Click on the black and white Qube ArtistView desktop icon, or locate it in the Applications/pfx/qube folder
- Linux: Type Run 'qubeArtistView' at the shell prompt (no quotes). By default, qubeArtistView will be located in /usr/local/pfx/qube/qubeArtistView/.
You should see this:

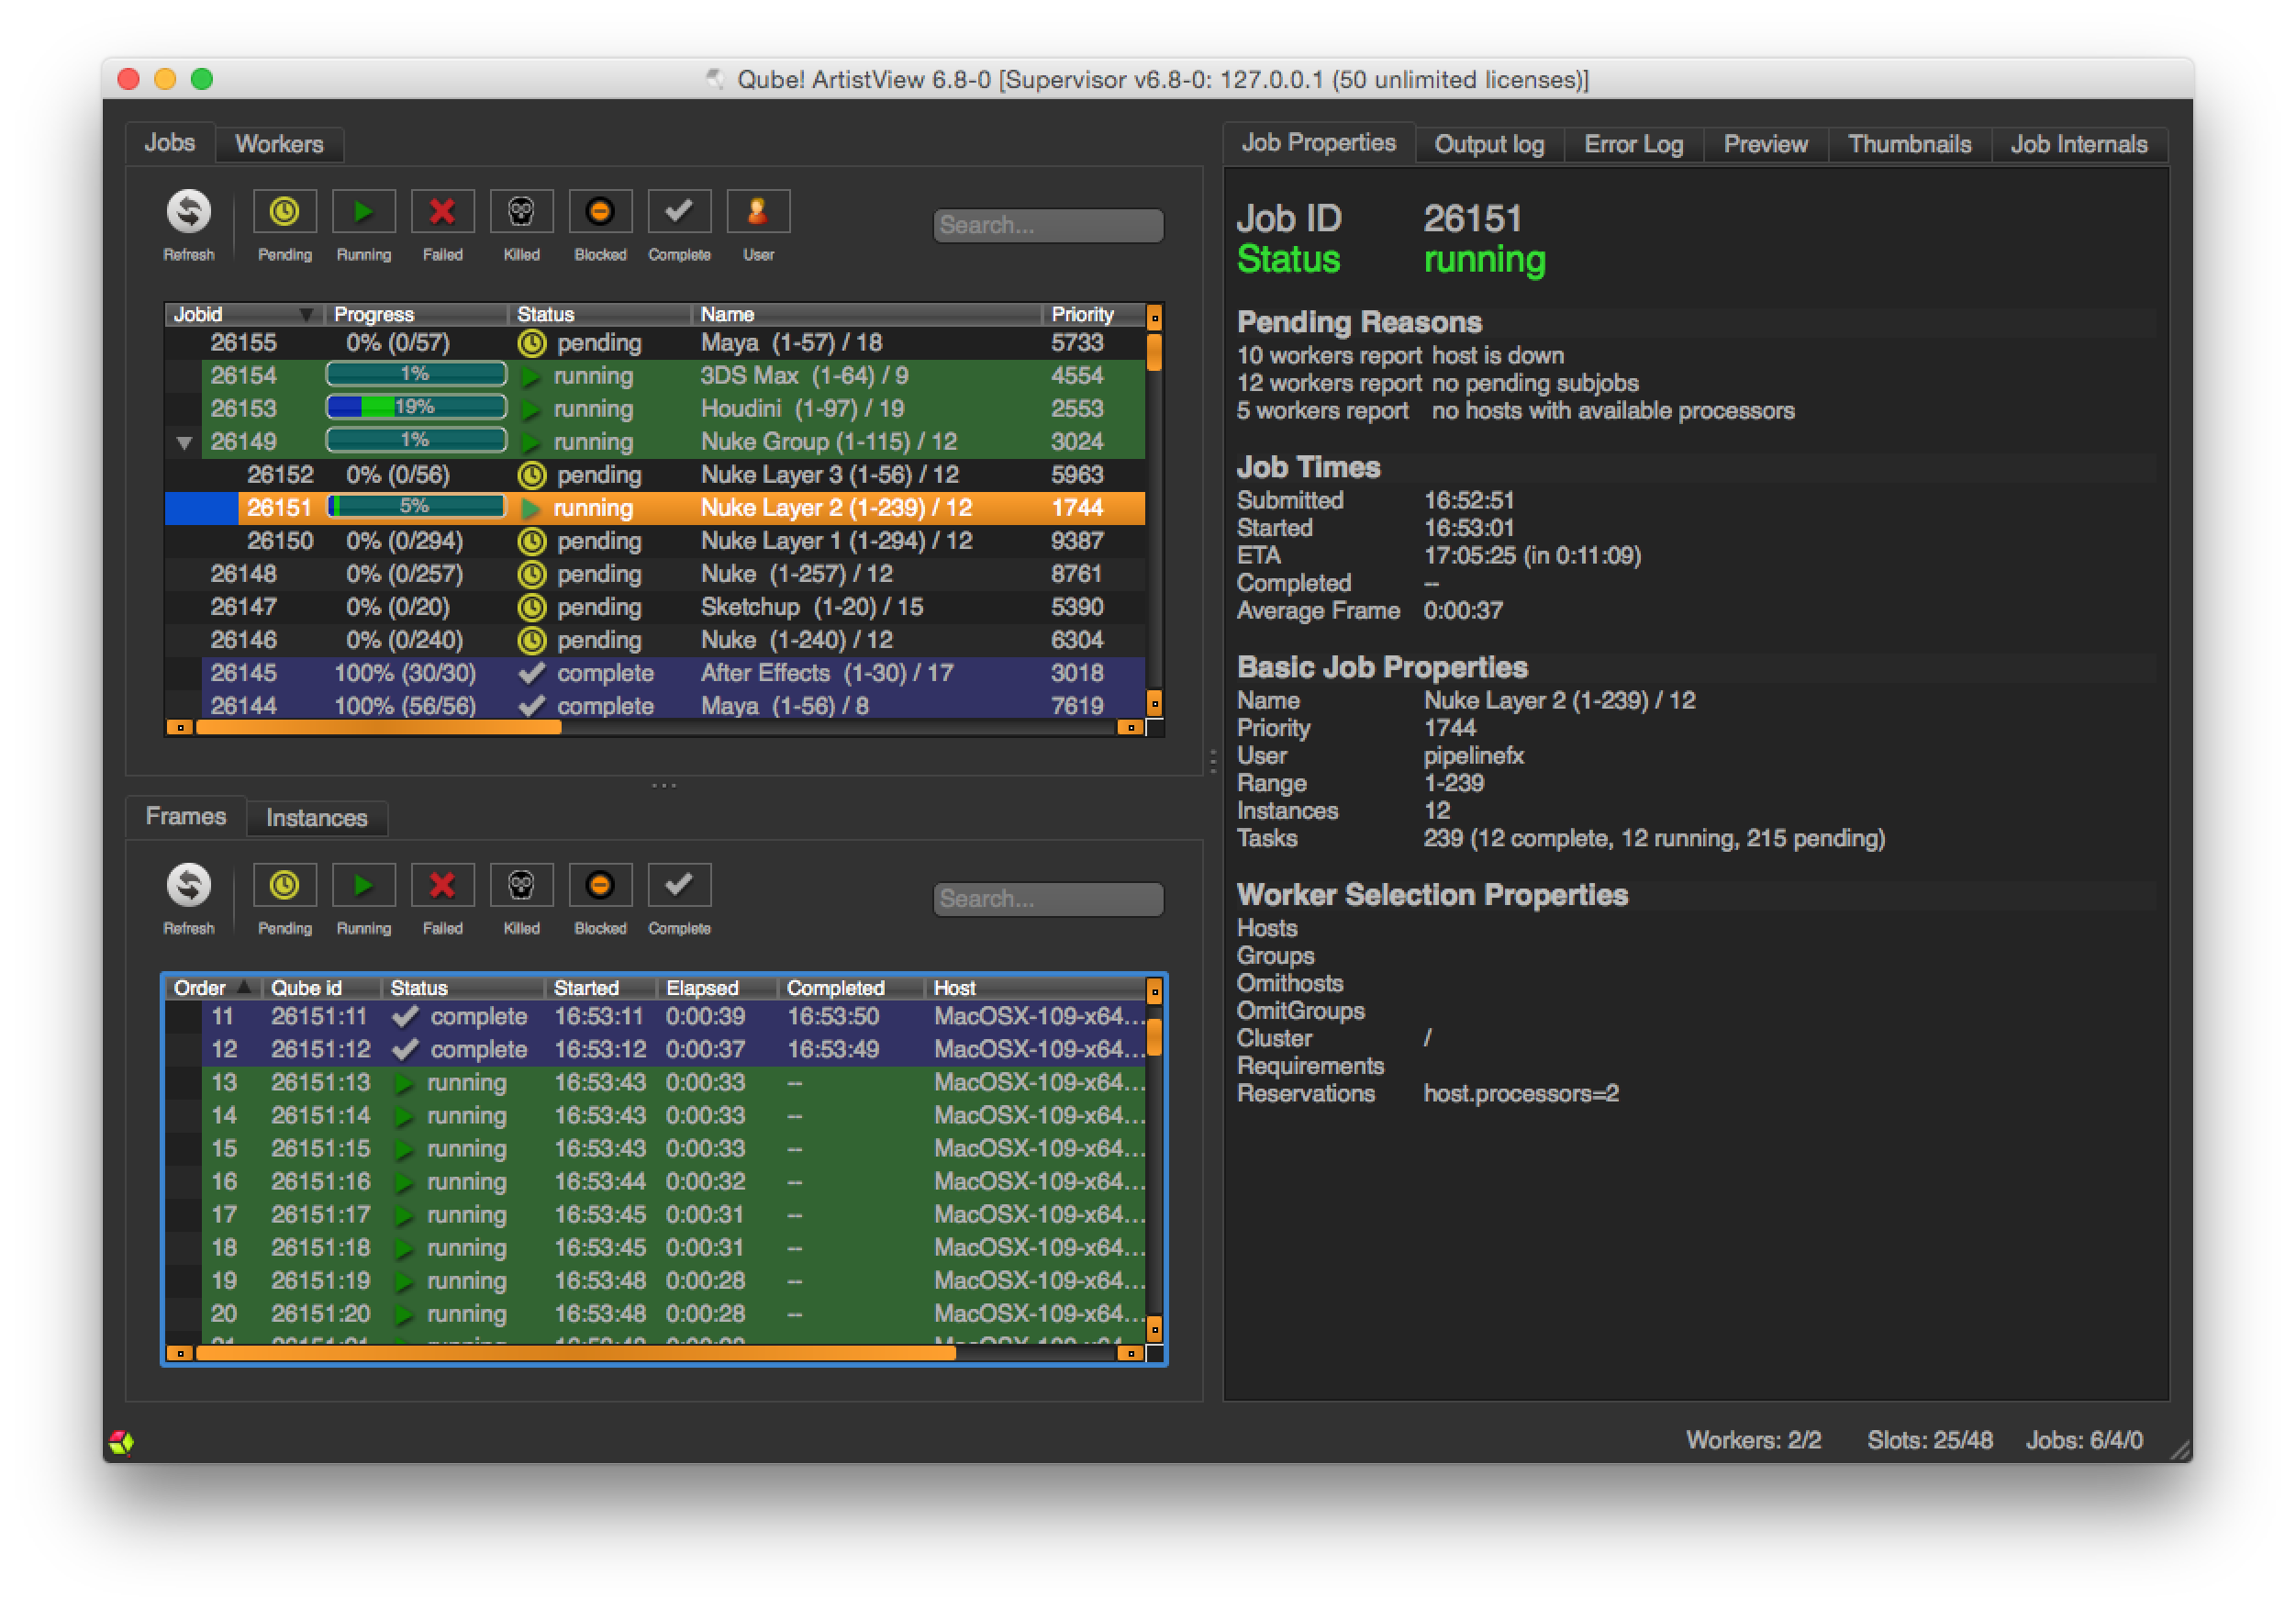
You should see the test jobs or other jobs that you have submitted. Notice that they are color coded - if you are lucky, they will all be blue, which is the color of a successfully completed job. Jobs which failed are colored red. The jobs also have a status, such as "complete", "failed" or "running." Running jobs are shown in green. There are other colors for other statuses, which you will become familiar with as you submit and monitor jobs.
...
The row of buttons just under the Jobs tab is a set of filters which will show or hide jobs in the Jobs Panel. An important one to know about is the User Filter - when set, you will only see your own jobs. When unset, you will see all jobs. Click and unclick this button to see the difference. Note that if you are on Linux, you may have submitted jobs as the root or qubeproxy user which will be hidden if you choose this filter.

Let's have a look at some simple tasks you can do from this UI. The Jobs pane shows your job(s). By default, they are sorted by Jobid, but you can sort them by any other column by clicking on the column header. For example, you can sort them by Name by clicking on the "Name" label at the top of that column. Clicking once sorts them in ascending order, clicking again sorts them in the other direction. Now, click on one of your test jobs in the Jobs pane.
...
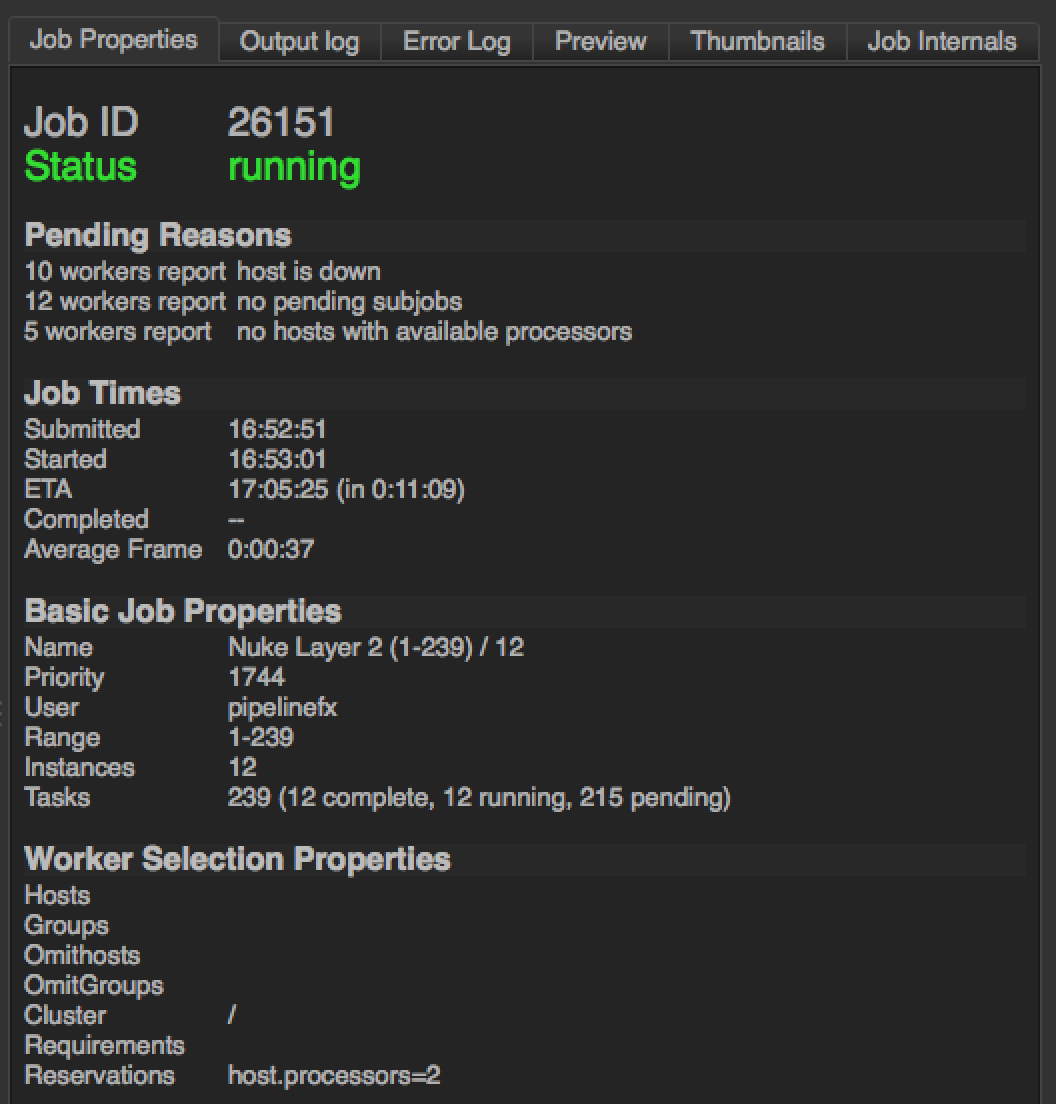
Notice that in the panel below the Jobs panel, you can look at the Job Properties on one tab, and the Output on the next two tabs (Output Log & Error Log). This is the Job Details panel - we'll cover that in a second.

Interact with a Job
...
Once a job is running, if it takes more than a few seconds (and most do) then you will want to keep an eye on progress. By default, the UI does not refresh itself, meaning that as the job progresses, nothing will change in the interface. You can force a change an update by simply clicking on the appropriate refresh button. Notice that there are two, one for the overall job progress and another for the individual frame updates.

or you can job. You can also refresh all jobs or frames or instances or hosts by clicking the "Refresh" button associated with their list.
You can also configure Qube to automatically update the UI every so often. To do this, go to Edit in the top menu and choose Preferences. Click on Auto Refresh / Interval. You can leave the refresh interval at 60 seconds, or make it shorter or longer.
...